(800) 337-4002
call for your free personal
injury case consultation
Available 24/7
injury case consultation
Available 24/7
In the United States, nearly a quarter of all traffic fatalities and roughly half of all traffic injuries occur at intersections. Known as ‘planned points of conflict’, intersections are a perennial focus among local, state and federal organizations to improve and maintain road safety.
With this in mind, how safe are our intersections in Lexington? Where are motorists more likely to be injured in a traffic collision?
With the help of 1Point21 Interactive, we examined four years of collision data from the Kentucky State Police to identify the most dangerous intersections in Lexington (and all of Fayette County). Of course, you can always speak to a skilled accident lawyer in Lexington to learn more.
From 2022-2025 (the latest full year available), there were 7,242 crashes that resulted in an injury or death in Fayette County, second only to Jefferson County with 18,112. Nearly 35 percent of these crashes (2,923) were intersection-related – accounting for 2,875 injuries and 48 deaths.
Through this lens, it appears that, overall, intersections in Louisville and Fayette County are relatively safe when compared to the U.S. as a whole (the U.S. DOT estimates that half of all injury crashes occur at intersections).
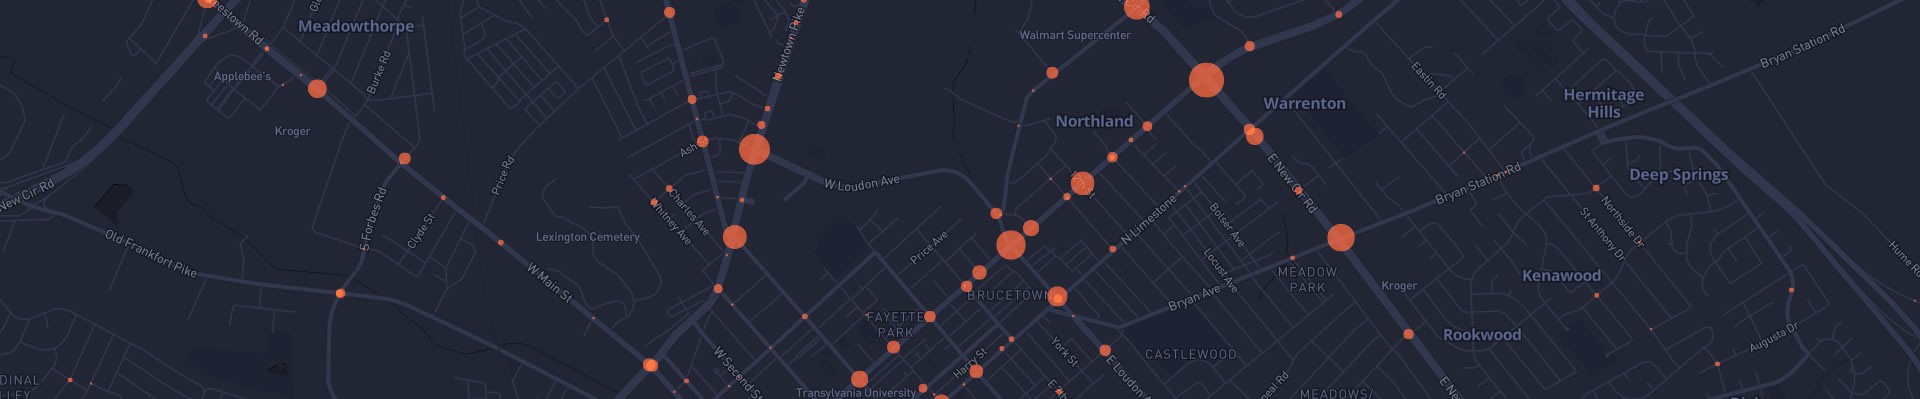
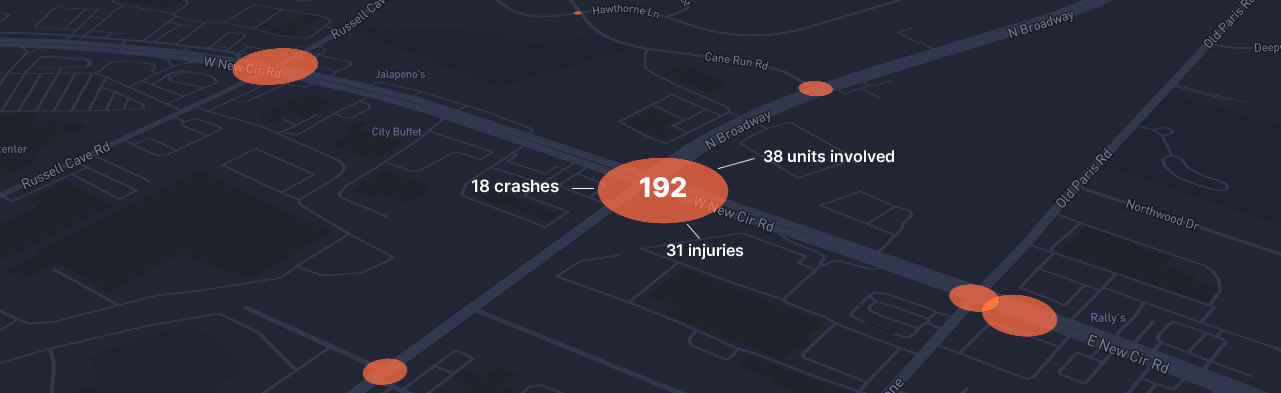
The map below shows all intersections in Fayette County where at least one collision occurred. The larger the circle size, the more dangerous that intersection is, as circle size is determined by that crossing’s CRS score. This map is interactive, zoom in and hover over each intersection to reveal more information.
*The map reflects data from 2017-2019 and does not reflect the current numerical data in the study.*
Which intersection is most dangerous? We created a CRS index that weights collision and injury volume to rank each crossing where at least one injury or fatal collision occurred. Below are the 50 most dangerous intersections in Lexington and Fayette County.
| Rank | Road 1 | Road 2 | Crashes | Injuries | Fatalities | CRS |
|---|---|---|---|---|---|---|
| 1 | Broadway | Cane Run Rd | 15 | 31 | 0 | 170 |
| 2 | Liberty Rd | Star Shoot Pkwy | 13 | 27 | 0 | 148 |
| 3 | Man O War Blvd | Pimlico Pwky | 13 | 27 | 0 | 148 |
| 4 | Georgetown Rd | Citation Blvd | 17 | 26 | 0 | 147 |
| 5 | Man O War Blvd | Crosby Dr | 12 | 22 | 0 | 122 |
| 6 | Tates Creek Rd | Man O War Blvd | 13 | 21 | 0 | 118 |
| 7 | New Circle Rd | Russell Cave Rd | 13 | 20 | 0 | 113 |
| 8 | Richmond Rd | Man O War Blvd | 13 | 20 | 0 | 113 |
| 9 | Man O War Blvd | Palumbo Dr | 12 | 20 | 0 | 112 |
| 10 | Man O War Blvd | Polo Club Blvd | 11 | 20 | 0 | 111 |
| 11 | Harrodsburg Rd | Wellington Way | 10 | 20 | 0 | 110 |
| 12 | Alumni Dr | Yellowstone Pkwy | 12 | 28 | 0 | 102 |
| 13 | Leestown Rd | Citation Blvd | 7 | 15 | 2 | 102 |
| 14 | Newtown Pike | Coleman Ave | 14 | 17 | 0 | 99 |
| 15 | Nicholasville Rd | Malibu Dr | 9 | 18 | 0 | 99 |
| 16 | Tates Creek Rd | Malibu Dr | 11 | 17 | 0 | 96 |
| 17 | Nicholasville Rd | Zandale Dr | 10 | 17 | 0 | 95 |
| 18 | Nicholasville Rd | Southpoint Dr | 9 | 17 | 0 | 94 |
| 19 | Man O War Blvd | Parkers Mill Rd | 8 | 17 | 0 | 93 |
| 20 | Man O War Blvd | Belleau Wood Dr | 8 | 15 | 1 | 93 |
| 21 | Richmond Rd | Eagle Creek Dr | 10 | 16 | 0 | 90 |
| 22 | Man O War Blvd | Clays Mill Rd | 8 | 16 | 0 | 88 |
| 23 | New Circle Rd | Young Dr | 8 | 16 | 0 | 88 |
| 24 | Broadway | 6th St | 11 | 15 | 0 | 86 |
| 25 | Limestone St | Virginia Ave | 10 | 15 | 0 | 85 |
| 26 | Nicholasville Rd | Southland Dr | 10 | 15 | 0 | 85 |
| 27 | Nicholasville Rd | Man O War Blvd | 7 | 15 | 0 | 82 |
| 28 | Broadway | Vine St | 10 | 14 | 0 | 80 |
| 29 | Versailles Rd | Alexandria Dr | 9 | 14 | 0 | 79 |
| 30 | Citation Blvd | Sandersville Rd | 8 | 14 | 0 | 78 |
| 31 | Limestone St | Transcript Ave | 8 | 14 | 0 | 78 |
| 32 | Citation Blvd | Georgetown Rd | 7 | 14 | 1 | 77 |
| 33 | Man O War Blvd | Winthrop Dr | 7 | 14 | 0 | 77 |
| 34 | Broadway | 5th St | 11 | 13 | 0 | 76 |
| 35 | Broadway | Loudon Ave | 10 | 13 | 0 | 75 |
| 36 | New Circle Rd | Liberty Rd | 9 | 13 | 0 | 74 |
| 37 | New Circle Rd | Meadow Ln | 9 | 13 | 0 | 74 |
| 38 | Harrodsburg Rd | Ft Harrods Dr | 8 | 11 | 1 | 73 |
| 39 | Richmond Rd | Locust Hill Dr | 10 | 12 | 0 | 70 |
| 40 | Georgetown Rd | Spurr Rd | 8 | 12 | 0 | 68 |
| 41 | Man O War Blvd | Nichols Park Dr | 8 | 12 | 0 | 68 |
| 42 | New Circle Rd | Eastland Pkwy | 8 | 12 | 0 | 68 |
| 43 | Nicholasville Rd | Moore Dr | 7 | 12 | 0 | 67 |
| 44 | Versailles Rd | Viley Rd | 7 | 12 | 0 | 67 |
| 45 | Limestone St | Conn Ter | 8 | 11 | 0 | 63 |
| 46 | Man O War Blvd | Saron Dr | 8 | 11 | 0 | 63 |
| 47 | Richmond Rd | Locust Hill Dr | 8 | 11 | 0 | 63 |
| 48 | Tates Creek Rd | Gainesway Dr | 8 | 11 | 0 | 63 |
| 49 | Richmond Rd | New Circle Rd | 7 | 11 | 0 | 62 |
| 50 | Broadway | New Circle Rd | 8 | 9 | 0 | 53 |
*In the event that a CRS score was the same for two or more intersections, ties were broken by fatality/injury/crash volume – in that order.
Six of the ten most dangerous intersections involved Man O’ War Boulevard or Broadway. the two most consistently high-risk roadways in the county include Man O’ War Blvd, appearing at 13 intersections in the top 50 and, Broadway, accounting for six.
When compared with all collisions where Rear-end crashes are most common, those that occur at intersections are much more likely to involve angle and opposing left-turn collisions. In fact, those are the two most common types of intersection crashes in Lexington.
Intersection collisions occur most often in July, September, and October
As personal injury attorneys in Lexington, we are passionate advocates for public safety. We believe that empowering people with information can go a long way in that regard. If people are aware of where collisions are more frequent, they may adjust their routes and driving behaviors around that knowledge. If our report can help even one person avoid a serious collision or injury, it will all be worth it.
When evaluating the data, it is important to understand that there are many factors that may lead to collisions including traffic volume, driver behavior, visibility and effectiveness of traffic control devices, road conditions, weather, and lighting to name a few. Drivers can increase their odds of arriving at their destination safely by:
This study uses injury and fatal crash data from the Kentucky State Police for the years 2022 – 2025. Our rankings are based on collision and injury volume at a given intersection. If you would like to report on or republish the data, maps, or information within, please link back to this page to provide credit to our firm.